WEBINAR: DATA VISUALIZATION USING PYTHON
WEBINAR: DATA VISUALIZATION USING PYTHON
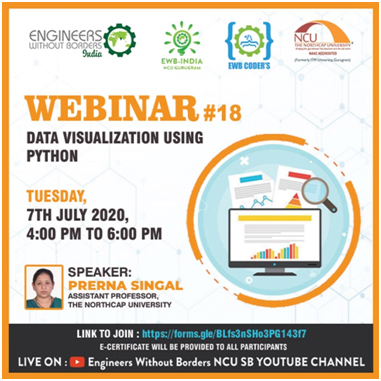
EWB Coders conducted a webinar on Data Visualization using python on youtube live platform. The speaker started with basics of python and then moved to the data visualization part and explained different types of graphs which can be drawn using 2 mostly used libraries matplotlib and seaborn. Later speaker answers all the doubts asked by the students